Together with the Pro version of Homeseer, the HSTouch tool is available for free. If you follow the threads on the Homeseer board forum, you will get familiar with the struggling issue that HSTouch has to offer, including the very, very very old look and feel of the provided background, button images, etc. Of course, you can create yourself images and backgrounds, even you are able to use icon sets from the internet. Besides this, I’ve created many dashboards in the last few years. One big disadvantage of HSTouch is that it’s not responsive at all. Per dashboard a static resolution has to be set, so per device, you have to create your dashboard a new. At least the resolution changed, so the layout of all the screens in your dashboard has to be redefined. One advantage is that you have direct access to the devices in Homeseer. Adding a device status or control is made easily via dropdown menus.
Year 2011:
My first dashboard in HStouch has the following layout. The default buttons are used here (images are clickable).
As I far can remember, I used the dashboard on a 7″ Lilliput resistive touchscreen.

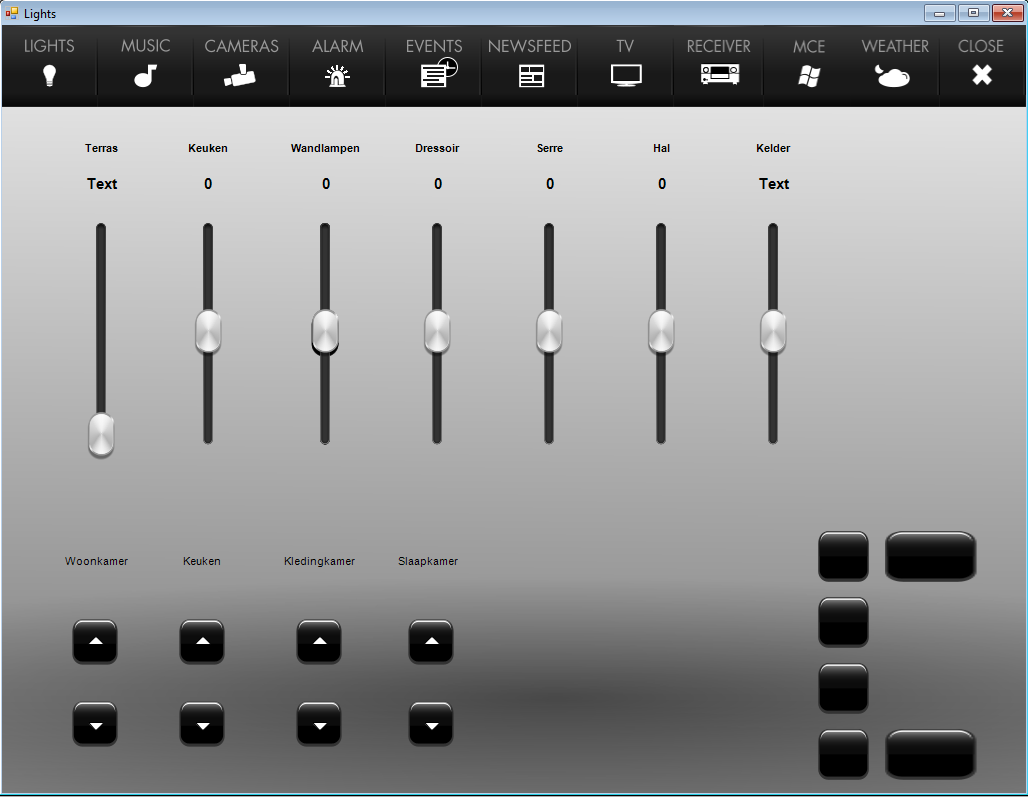
The next dashboard looks much nicer and for this an out of the box background is used:

A phone interface could be made like this:
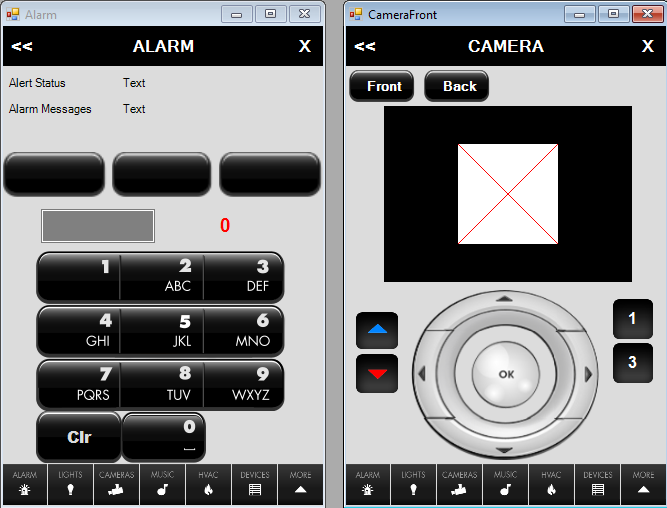
Well, as you can see, the development was not making any progress in a nicer look and feel. Personally, I’m not able to create proper images or nice-looking buttons, but one of the members on the Homeseer forum ís able to do this. As I can remember it correctly it was “Robin” aka “R_255”, this member created much nicer looks and feel and shared the dashboard with many users. If you are using this layout only, only the devices have to be added to all the buttons and controls. The buttons are also standard:

Year 2012:
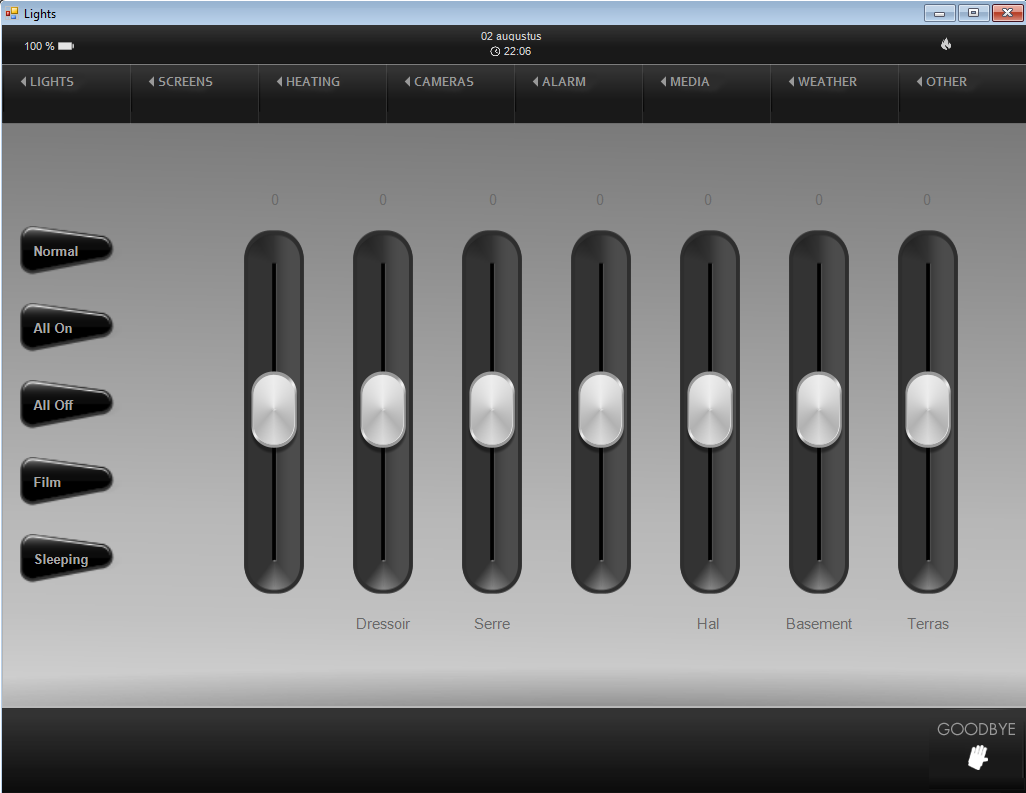
I’ve used the above layout to find a way to create new screens:
New phones, new touchscreens, tablets, etc. Every time the layout of the dashboards has to be changed to new resolutions.. I spend many hours to find a good solution for a way I’m unfamiliar with, like a ‘website’ to show my device statuses.
For Homeseer 2 at this time, an easy connection was made via the format “hs->devicevalue(“xx”). It was easy to start a refresh on a page and pull the data from Homeseer and show it on a website.
For this, I created a long post on the Dutch forum domoticaforum.eu: https://www.domoticaforum.eu/viewtopic.php?f=17&t=8956
Year 2013:
It was a first step in the direction I want to have. Biggest advantage: it’s responsive!! One dashboard for all devices.
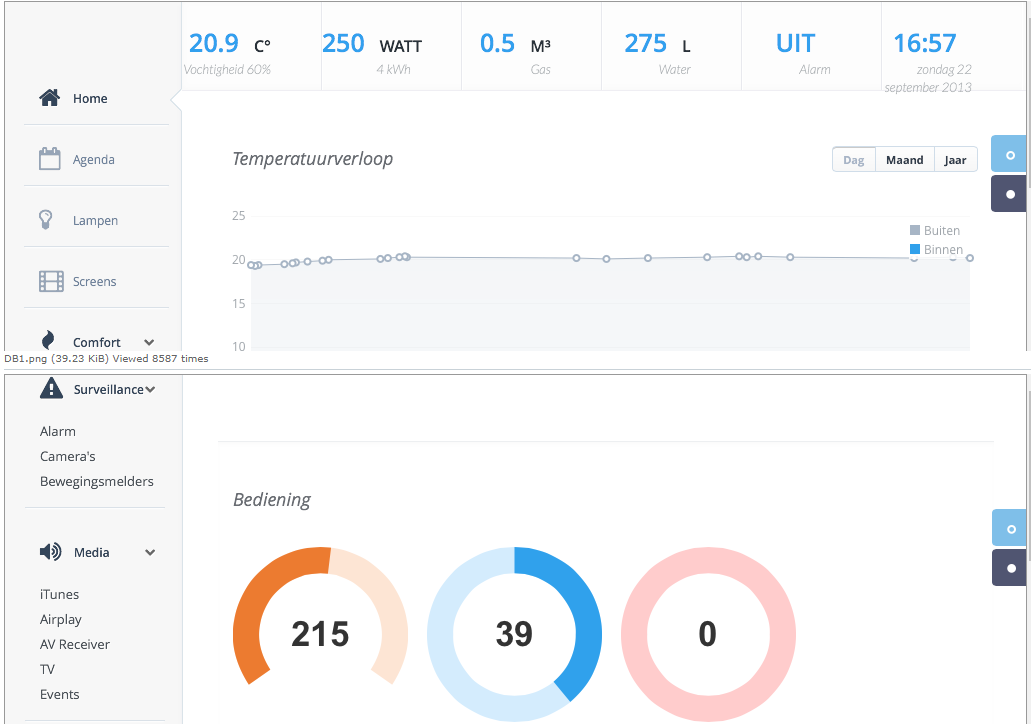
Even I was able to use the donut charts at the bottom of the screenshot, to show data. The first one “215” should display the temperature of the room setpoint (21,5 degrees).
Between 2013 and 2017 I experienced with many other website templates and spend a quite amount of money on all those 15-70 euros themes….Themes with demo content look always nice, but when you change it with your own data it’s rubbish….even a connection to Homeseer and controlling the devices are sometimes quite a challenge.
Year 2016:
Because Homeseer 3 is not able to have a direct connection on the application level to retrieve device values in a script (besides using JSON or API calls). I’ve created a vb.NET script that will run at every device change and store all the changes in a MySQL database, which is explained in my post: https://www.rutg3r.com/store-homeseer-device-parameters-into-mysql
Year 2017:
Based on the first try to show ‘realtime’ values on a website, in almost 4 years(!!) thinking and trying to get a responsive (near) realtime live on all my devices….I tried many website themes, but finally I was not satisfied with the results,…
In the past I used for every devicevalue a query. Finally I’ve every second 200+ queries that has to be run. Not an issue, but in the end it could result in performance issue and there should be a better solution.
Angularjs, nodejs, socketio, all is working nice, if you are using tables, but specifc value showing from the records it’s hard to do. Probably quite simple, but I can’t find any example how to accomplish this specific values instead of print all values in a table.
Few weeks ago I found this theme: wrapbootstrap.com/theme/minton-admin-fr … -WB0858DB6
I used the Dark version, in horizontal mode.
The 200+queryies are replaced with 3 queries that create an array of results from my MySQL DB:
1 array for device_ref + device value
1 array for device_ref + device string
1 array for device_ref + device last change
(probably this 3 arrays can be combined into one, but for now it me saved already a lot of work).
Below the first created dashboard. Some minor layout issues has to be fixed and the weather icons has to be linked to the correct one of the day and I’m not satisfied with all the text colors, so I’m starting to make it more clean, as you can see in the first row. Based on the value, it can be displayed in another color.
The icons at front of the ‘panels’ will be removed as well, unless I’ll found a nice set of icons somehere soon.
I’m far from finished.
Even some popups can be displayed when clicking on a value/panel, a notification can be shown automatically based on incoming events or values changes.(all is Bootstrap related)
The websites is running on my private server but can be accessed from the outside as well (or click on the “House” link in the top menu of the blog page.. Its currently running in browsers were fullscreen mode is a standard feature because I don’t want to see the menubar, favorites, etc.
External view, as you can see some values are blocked for external users because of privacy. Alarm status, calendar items, camera images are not visible. Even controlling of devices isn’t possible from external view.
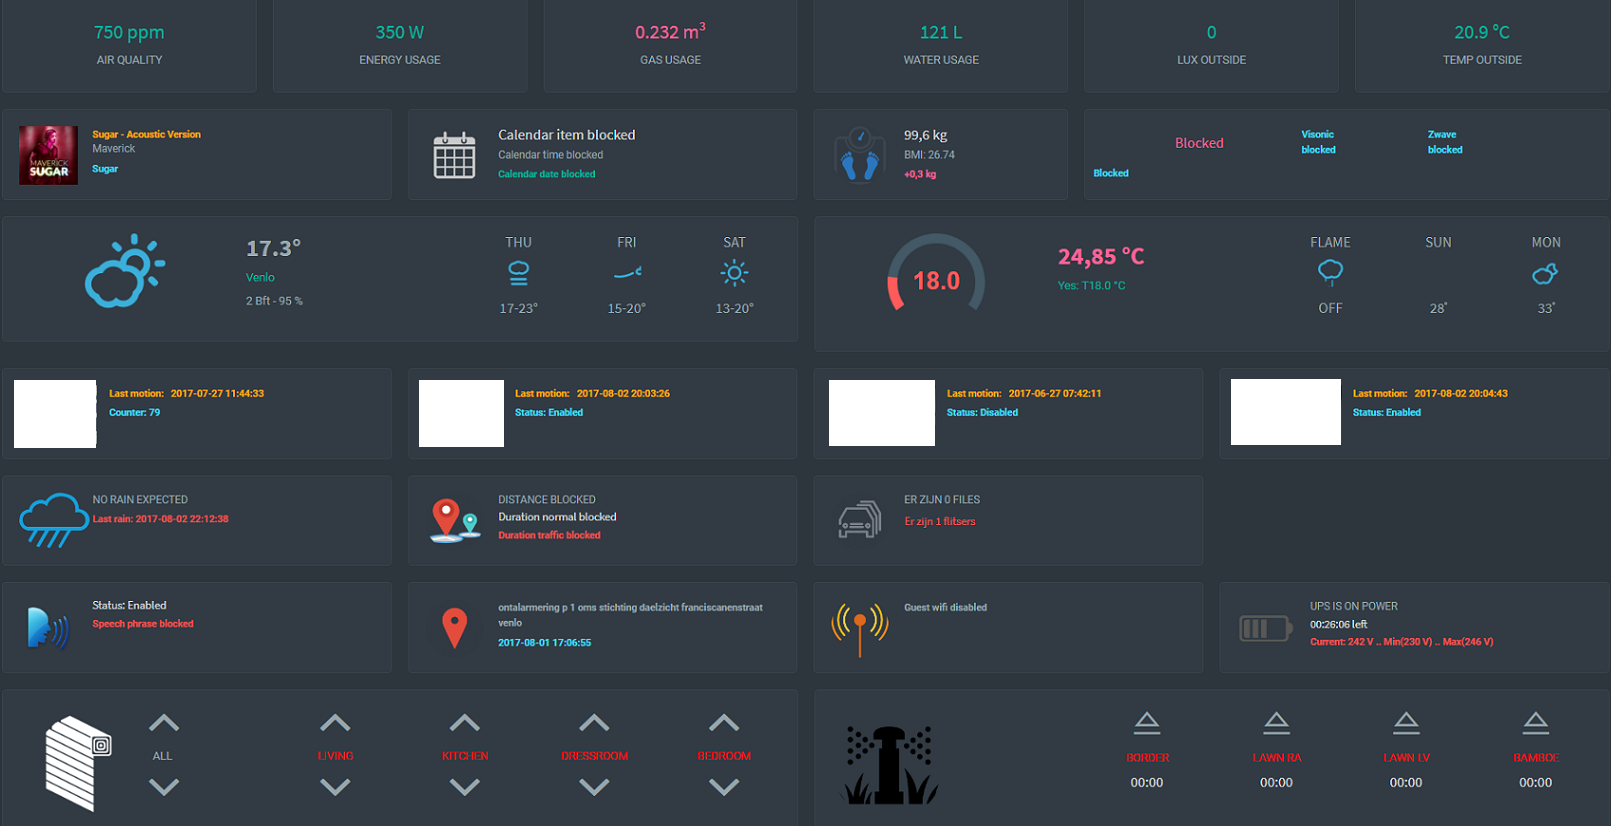
In both cases some values or images are clickable, for examples:
- Energy usage. A popup will appear with current energy, water and gas usage to today and yesterday. A second tab will shown the current energy usage of some Fibaro wallplugs.
- The “rain expected” block is clickable on the image, which will show a chart with rain precipitation (or can be empty ofcourse)
- “xx km to home” is clickable on the markers image. A popup will shown (based on Google DistanceMatrix API) what the expected duration time is by car between home and work and vice versa. On the main block the current duration time between my car and home will be shown.
- The single red marker block, will shown the last “P2000” notification in the Netherlands for area “Venlo”. It could be a notification for police, medical or fire department. If you click on the red marker, a popup will appear with the Google Maps location of the mentioned alarm.
- Finally the screens and irrigation sprinklers can be controlled directly from the dashboard.
It’s still work in progress and the idea is to show important and relevant data on the main screen. For not important or subdata a popup can be appear. Charts will be added later too on subpages.
Currently notifications are shown based on device triggers, like incoming phonecalls of when the doorbell rings, a live camera feed appear.
Setup realtime responsive website
Because my website theme is under license, I can’t share the sourcecode. It’s possible ofcourse to show the device value changes on a white page, but that isn’t the way I want to show it.
For this I’ve downloaded a Bootstrap dashboard, Bootstrap is for free and a there are a lot of free dashboards available, but also some under license.
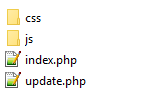
The following files you need to have:
- index.php (main file to load the website)
- update.php (connection to MySQL DB, define device variables and create div’s)
- css file+folder
- javascript file+folder
We will start with the file “update.php”
This file will contain the MySQL queries and device variables.
First thing to do is to make a connection to the database in MySQL:
- connect to MySQL table $con = mysqli_connect(‘localhost’, ‘DBusername’, ‘DBpassword’, ‘DBname’);
Create a query and slect the column names you want to have in your query output:
- $query = “SELECT id,device_id,device_value,device_string,device_lastchange FROM devices”;
Finally, run the query and store the output in variable “$result”:
- $result = mysqli_query($con, $query);
In my case, I will run 3 scripts:
- to get all device values
- to get all device strings
- to get all last changes
I know it’s possible to run these 3 results in one query too, but for now this is working fine (before this website, I ran for every devicevalue, etc a seperate query…so this is a big improvement already).
To get all device_values and put them in an array, run the following statement:
$dv = array();
while ($row = mysqli_fetch_assoc($result)) {
$dv[$row[‘device_id’]] = $row[‘device_value’];
}
After this, it’s easy to define a variable and use the Homeseer device reference to get that specific value. Some examples:
- $ppm = $dv[‘1451’];
- $eye_lux = $dv[‘2242’];
Even you can do some “translations/replacements” (I use it for alarm status as well):
- $eye_motion = $dv[‘2240’];
if ($eye_motion == “0”) {$eye_motion = ‘No Motion’;}
if ($eye_motion == “255”) {$eye_motion = ‘Motion’;}
In the file you will see the queries for device_strings and device_last_changes as well.
Finally when the mySQL connection is closed and the php area is closed, you can device the divs
In this case the div will contain de device output, just in plain text of with some extra layout of texts.
The div is in HTML layout but the device output will be done via php (php comman dinside the div).
To show the output of the above mentioned “ppm” variable, you can shown it for example with a color range. Depending of the value the text color is changing.
First step is to set a opening div, before define any other device realted divs. Define a div with the name tag and then output the device. Every div should have a unique id name. A div can contain multiple devices.
<div id=”ppm”>
<?php
if($ppm < 1000)
echo “<h3><p style=’color:#00B19D’>$ppm ppm</p></h3>”;
if($ppm > 990 AND $ppm < 1501)
echo “<h3><p style=’color:orange’>$ppm ppm</p></h3>”;
if($ppm > 1500)
echo “<h3><p style=’color:red’>$ppm ppm</h3>”; ?>
</div>
or just simple:
<div id=”eye_lux”>
<?php echo $eye_lux;?>
</div>
You can extra text behind the device output (in this case it will be shown as ” 23,45 °C ”
<div id=”living_temp”><?php echo $living_temp. ” °″ . “C”;?></div>
Finally when all divs are defines, you have to close the page at the bottom with a closing div: </div>.
Now it’s time to open the index.php file.
The index,php file will contain a jquery script that will run every xx second to retrieve all defined divs from the update.php file.
Besides this this file contain the layout of your website and therefor you have to display the divs somewhere.
The script below wwill get all data from update.php every 1000ms (1 sec).
As you can see, you have to declare every ppm you want to show on index.php over here. updat.phpp can contain more divs, but the actual content will be retrieved here.
The following scripts are necessary for this div refresh setup:
- <script type=”text/javascript” src=”js/jquery-1.10.2.min.js”></script>
- <script type=”text/javascript” language=”javascript”>
$( function() {
checkForChange();
});
function checkForChange() {
var postData = “”;
$.ajax( {
url : ‘update.php’,
type : ‘post’,
data : postData,
success : function( resp ) {
$(‘#ppm’).html($(‘#ppm’ , resp).html());
$(‘#ppm_max’).html($(‘#ppm_max’ , resp).html());
$(‘#eye_temp’).html($(‘#eye_temp’ , resp).html());
$(‘#eye_motion’).html($(‘#eye_motion’ , resp).html());
$(‘#eye_lux’).html($(‘#eye_lux’ , resp).html());
$(‘#living_temp’).html($(‘#woonkamer_temp’ , resp).html());
setTimeout(“checkForChange()”, 1000);
}
});
return false;
};
</script>
To show the content of the div on womewhere on index.php, you have to use the command with the div id: “<span id=”ppm”></span>”. In this case the content of the div id “ppm” will be shown and the device value will be refreshed every second (without flikkering).
The default dashboard will be shown like this:
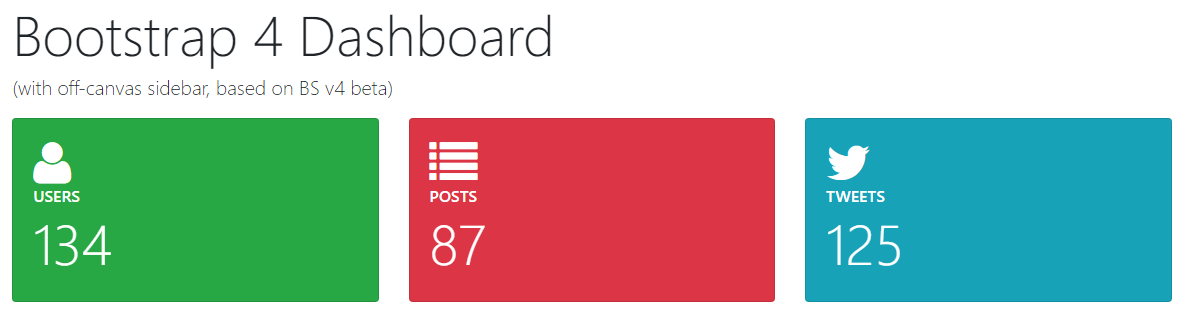
When we want to replace the green area with “users” and “134” , so we will search for this this in the index.php file:
<div class=”col-xl-3 col-sm-6″>
<div class=”card bg-success text-white h-100″>
<div class=”card-body bg-success”>
<div class=”rotate”>
<i class=”fa fa-user fa-3x”></i>
</div>
<h6 class=”text-uppercase”>Users</h6>
<h1 class=”display-4″>134</h1>
</div>
</div>
</div>
We are going to change the next 2 lines:
- <h6 class=”text-uppercase”>Users</h6>
- <h1 class=”display-4″>134</h1>
and extended these with just text and a div content:
- <h6 class=”text-uppercase”>PPM</h6>
- <h1 class=”display-4″ id=”ppm”></h1>
The final result after refreshing the index.php file will be like:
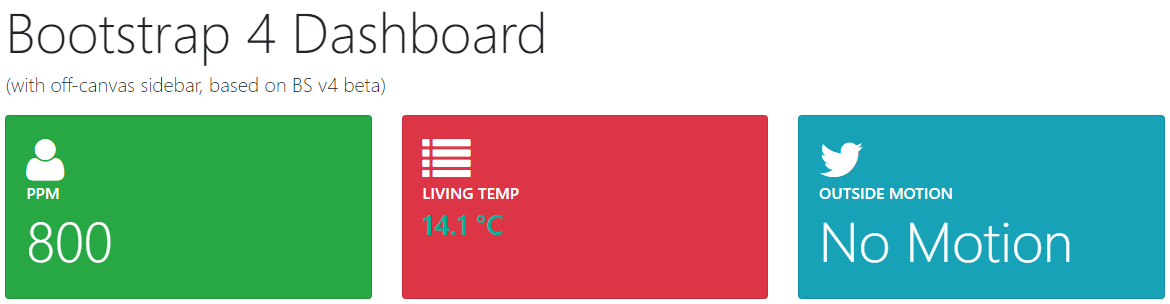
layout tags are not changed, so that is up to you.
To test you realtime website, use a doorsensor, or put the “tijd (=time)” div somewhere
Download Free Bootstrap realtime responsive dashboard:
 Bootstrap-realtime-website-Rutg3r (42.4 KiB, 874 hits)


That looks very very nice. Thank you. I’ve been using Imperihome and would like a different option for tablets. How do you find the 1 second refresh interval? Is that enough time for the settings to update?
Also had to you control things like lights, invoke a manual event and so on?
Hi Jack, thnx for the compliment. The refresh of 1 second is more than oke for me. It’s almost realtime, despite the device has to send it’s status to Homeseer, Homeseer write the change in MySQL and then the value is retrieved from MySQL and provided on the dashboard. You may reduced the refresh timeout ofcourse. The dashboard is even the most of the time not visible for me. My Smarthome, is really smart, so I don’t need to control my devices manually. In case I do want to control something manually, I use speech(Alexa) to control it via Homeseer. Mostg used devices are lights, screens and heating. But even all of these 3 are controlled based on motion presence and distance(gps).
In case I do want to use the dashboard, I’ve connected an icon/button directly to an Homeseer Event.
The icon showed above “Living temp” in the provided dashboard will be changed to a hidden button:

line 134:
Where Porchlight is the name of your Homeseer event. In my case the event start a .vb script, that will toggle the status of the porchlight. If Porchlight = ON, then swtich it to OFF and if porchlight = OFF then switch it ON:
Sub Main(ByVal Parms As Object)
Dim porchlight = hs.devicevalue(1644)
If porchlight = 100 Then
hs.setDeviceValueByRef(1644, 0, true)
Else
hs.setdevicevaluebyref(1644, 100, true)
End If
End Sub
Place the following script at the end on the index.php, but before the tag, so it will be trigegrred by a press on the hidden button.
Great, thank you! Once I have your script up and running I might take a look at WebSockets.
I seem to get getting an error compiling your MySQL_Devices script. Have you seen this before?
Nov-19 21:19:42 Error Compiling script MySQL_Devices.vb: ‘Dispose’ is not a member of ‘MySql.Data.MySqlClient.MySqlDataReader’.
Nov-19 21:19:42 Error Compiling script MySQL_Devices.vb: Namespace or type specified in the Imports ‘System.Core’ doesn’t contain any public member or cannot be found. Make sure the namespace or the type is defined and contains at least one public member. Make sure the imported element name doesn’t use any aliases.
OK have the MySQL database updating. Thanks.
Hello, bravo for all articles which are very intérressants and done well.
I possess HS3 and I try to replace the part(party) HSTOUCH which aged badly.
Is there possible to test your interface ?
thanks
Lionel
Hi Lionel,
My website theme has a license so I can’t copy paste the whole source code here, but I’ll post on short notice some web files so you can test around with your own setup.
Kind reagrds,
Rutg3r
Hello Lionel,
I’ve added some information in the blog post about the setup of the realtime website. A download is available too.
Kind regards,
Rutg3r